[13.12.2023] First the regional geology was described and summarized to give an idea of the rock types present in the region and the types of deformation processes the subsurface went through. This bigger picture of the region was linked to the borehole data of the PVGT-LT1 well.
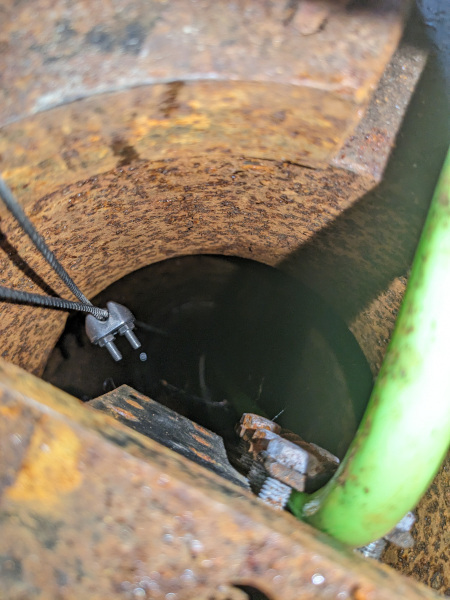
Results from well tests performed in the past were described and analyzed as this gives background information on a fracture that was reopened during one of those tests. During the course of the project a slug test was conducted while also using DTS and a water level measuring device.
These measurements were done to answer the three questions: is the fracture still open and to what extend? Is the fracture hydraulically connected to another zone and if so which zone? And finally, what is the length of the fracture? The slug test indicated that the fracture is still open, however it is unclear to what extent Based on the speed at which the water level decreased, as measured with a water level measuring device, the fracture seems to be hydraulically connected to a permeable unit or shallow aquifer. Lastly the question on the length of the fracture could not be answered with certainty as the unconventional way of the well test is not compatible with the conventional well test analyses. The question on the length of the fracture could not be answered with certainty as the unconventional way of the well test is not compatible with the conventional well test analyses.
The Electrical Resistivity Tomography gave an overview of the resistivity distribution of the subsurface, indicating horizontally continuous layering and the influence of the Elbe river. The measurements were conducted 400m east of the PVGT-LT1 borehole and along a section of 600m in length, a gradient array was used in the set-up. An anomaly was present in the ERT results which was caused by the presence of a pipeline.
Available gravity data in the region of Litoměřice was used to construct a map of the gravity field. The data was taken from the Czech Geological Survey, converted to a grid using universal kriging and visualized in a contour map. For the inversion of the gravity data the Linsser-Method was used. On the resulting map the location of remnants of volcanos and the Litoměřice deep fault can be recognised.
Thermal properties of cores were analysed using a Hot Disk and an optical scanner. As the drilling of a new well was delayed, cores from a uranium mine were used. This way the advantages and disadvantages of both methods could be argued and compared, as well as the (dis)similarity in results. No bias could be found in the results and there was no correlation between anisotropy and measurements differences. With the optical scanner the degree of (an)isotropy can be evaluated, while the Hot Disk gives the average of a surface. The optical scanner is more time efficient than the Hot Disk, as multiple samples can be aligned in one measurement. However, one huge advantage of the Hot Disk is being able to put the set up into the furnace in order to mimic the in-situ borehole conditions. The scanner is best applicable to get a quick overview of a large number of samples in a time efficient manner while the Hot Disk is better for further in-depth research of the thermal properties in a realistic environment.
Radar images from Sentinel-1 satellite were analyzed using Sentinel Application Platform (SNAP) to map the vertical deformation of the region between 2015 and 2023. As per the result of our study the region of Litomerice experienced a subsidence of 0.13 meters. Additionally, Global Navigation Satellite System (GNSS) data of Litomerice was used to study past surface deformation in the region. Five years of data between 2018 and 2022 was analyzed. An net uplift of 0.007 meters can be observed during the timeline, however, there is seasonality in the analysis of surface deformation.


